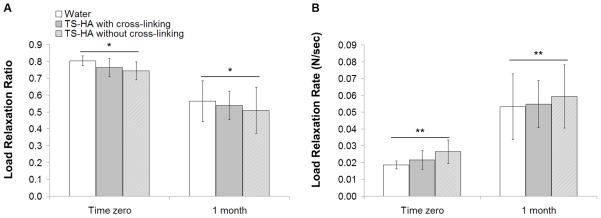
Figure 4.
(A) Load relaxation ratio and (B) load relaxation rate of water control, TS-HA with cross-linking, and TS-HA without cross-linking treated fascia at time zero and one month (n=7–8 per group per time point). *Load relaxation ratio significantly decreased with time (p<0.0001). **Load relaxation rate significantly increased with time (p<0.0001).

