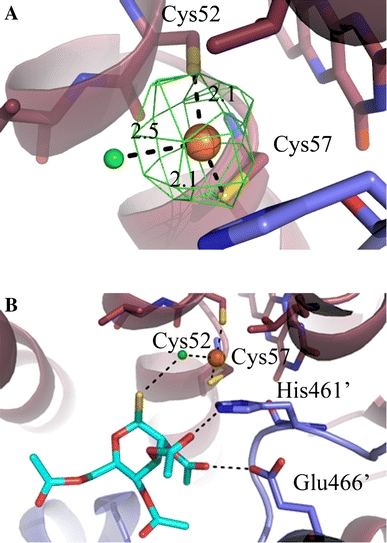
Fig. 4.

a Au(I) binding site. The gold and the chloride ions are indicated in orange and green, respectively. The anomalous difference Fourier map for data collected at the gold peak wavelength is shown at a 5σ contour level in green. b Trypanothione binding site. The Cys52, Cys57, Thr335, His461′, Glu466′ residues, the FAD molecule and the thiosugar moiety are represented as sticks. The pictures have been generated in PyMol (DeLano 2008)
