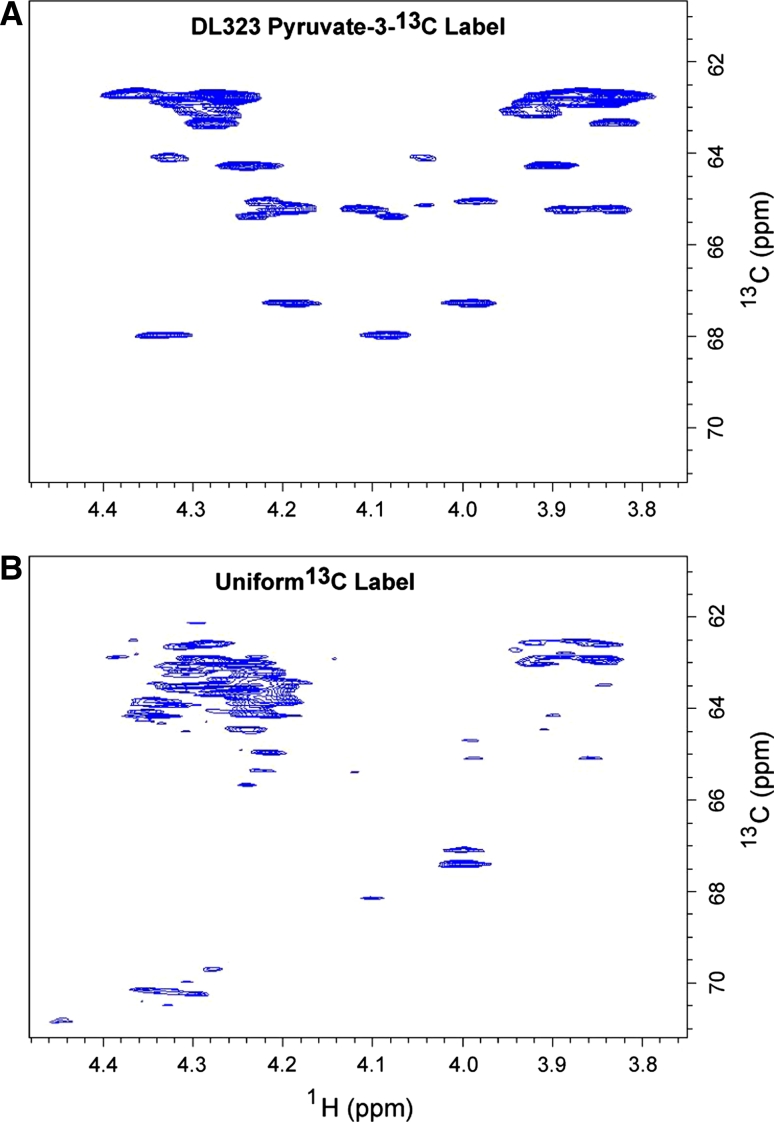
Fig. 6.
CH2-TROSY spectra depicting the C5′ region of A-Site RNA bound to paromomycin. Experiments were performed on the A-Site RNA a site-selectively 13C-GTP and CTP labeled and b uniformly 13C-GTP and CTP labeled. Spectra are plotted at identical contour levels. Notice the dramatic gain in sensitivity and resolution with the site selectively labeled sample

