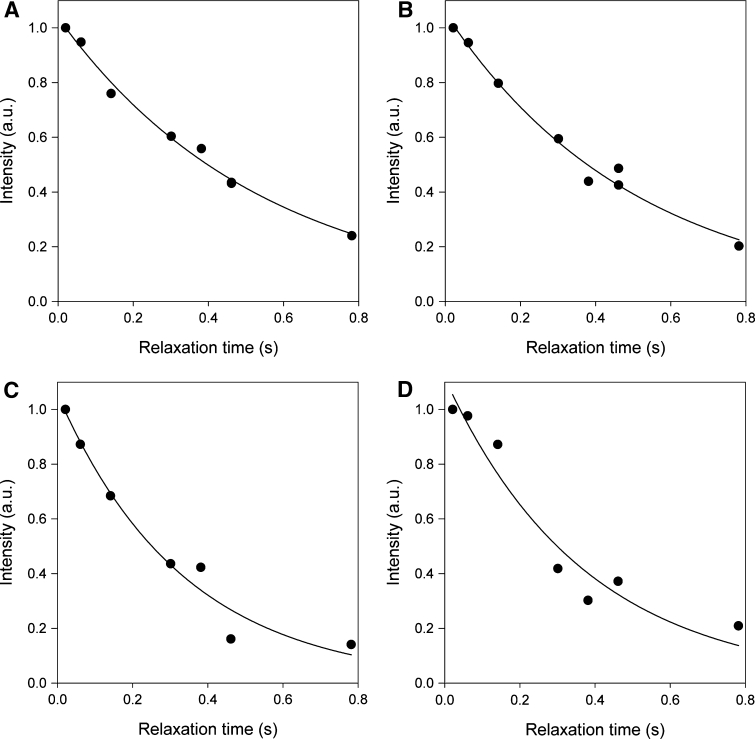
Fig. 7.
Representative longitudinal R1 relaxation decay curves showing deviation from monoexponential decay for uniformly labeled samples. Ribose C1′ R1 relaxation measurements at 25°C for the A-site RNA labeled with a site selectively-labeled ATP and b uniformly 13C/15N-labeled ATP. Ribose C1′ R1 relaxation measurements at 25°C for A-site RNA labeled with c site selectively-labeled GTP and CTP and d uniformly 13C/15N-labeled GTP and CTP

