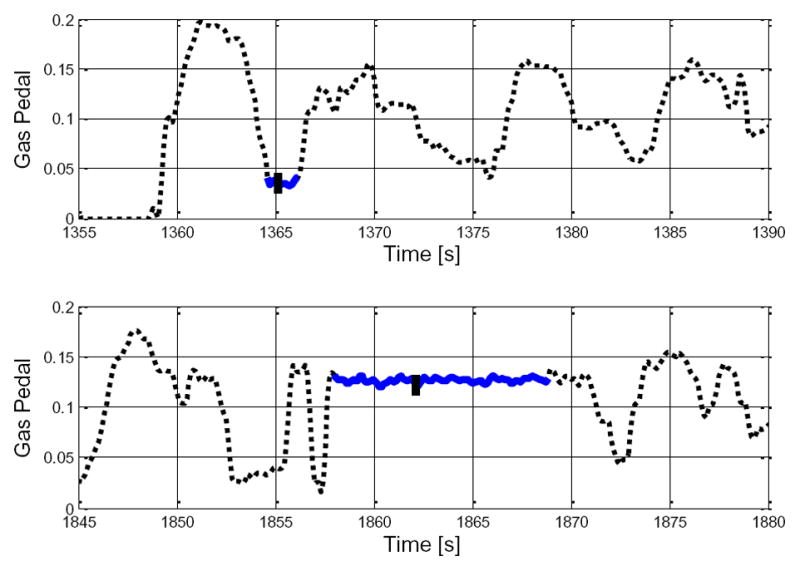
Figure.

A single gas pedal-hold time (PHT) calculation is depicted for two participants. Dashed lines represent actual pedal position. The solid line shows the time interval over which the gas pedal position changed <0.01 compared to pedal position at a specific time (at the vertical time-reference bar). In these examples, PHT is approximately 2s for a middle-aged driver at baseline (top) and 11s for a multitasking elderly driver (bottom). The within-person summary of PHT used in our analyses was the 25th percentile of the PHT values calculated at every specific time, as the vertical reference bar slides across a driver s time series data. Note that the PHT is calculated at every time point. This means that as the time-reference bar slides across the flat regions corresponding to high PHT s, there are many high PHT values that are nearly identical. Hence, using the 25th percentile, rather than a central value such as the 50th percentile or the mean, helps remove the redundancy caused by these repeated values. This choice of the 25th percentile was made a priori, rather than being based on empirical sensitivity.
