
Fig. 5.
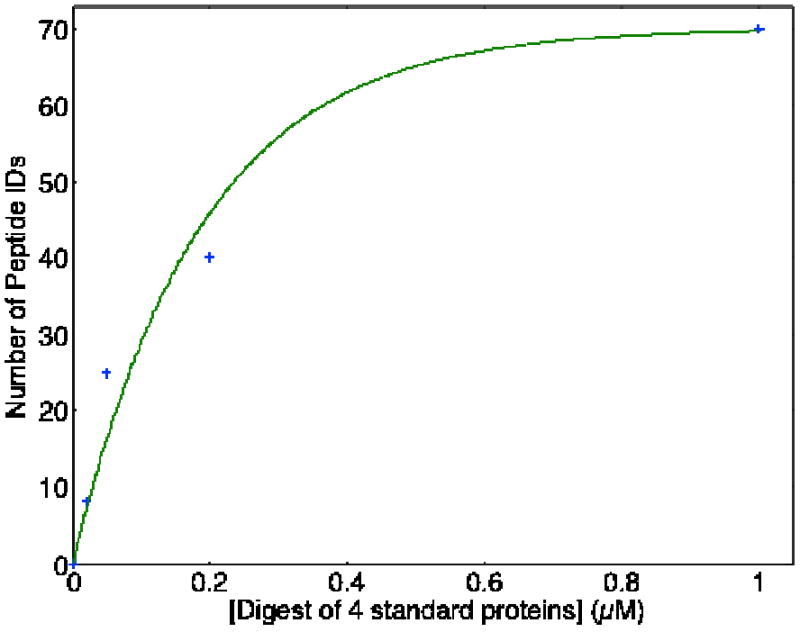
Number of unique peptide IDs (0.1%FDR) in triplicate runs of a four protein tryptic digest. The smooth curve is the result of a nonlinear least square fit of Peptide IDs = A*{1-exp(-B*[standards])}, where A = 70, B = 5.3 × 10⁶.
Official websites use .gov
A
.gov website belongs to an official
government organization in the United States.
Secure .gov websites use HTTPS
A lock (
) or https:// means you've safely
connected to the .gov website. Share sensitive
information only on official, secure websites.
Number of unique peptide IDs (0.1%FDR) in triplicate runs of a four protein tryptic digest. The smooth curve is the result of a nonlinear least square fit of Peptide IDs = A*{1-exp(-B*[standards])}, where A = 70, B = 5.3 × 10⁶.