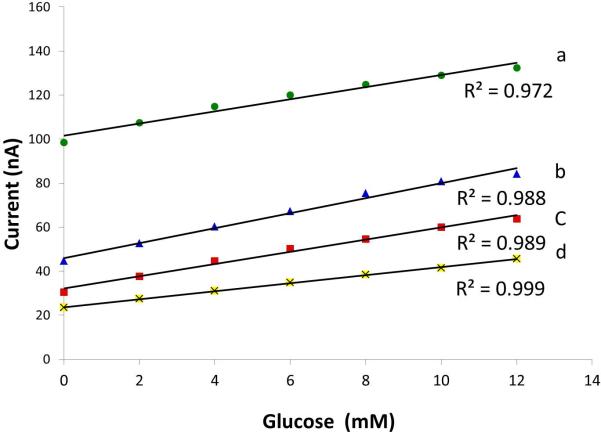
Figure 3.
Calibration curves of carbon paste containing glucose oxidase in 0.1 M phosphate buffer (pH 5.0, 6.0, 7.0 and 7.5 are indicated by a, b, c, and d, respectively) against an outside Ag/AgCl and Pt reference and counter electrodes with a detection potential of -0.05 V. Data were obtained from the current response after 5 seconds.

