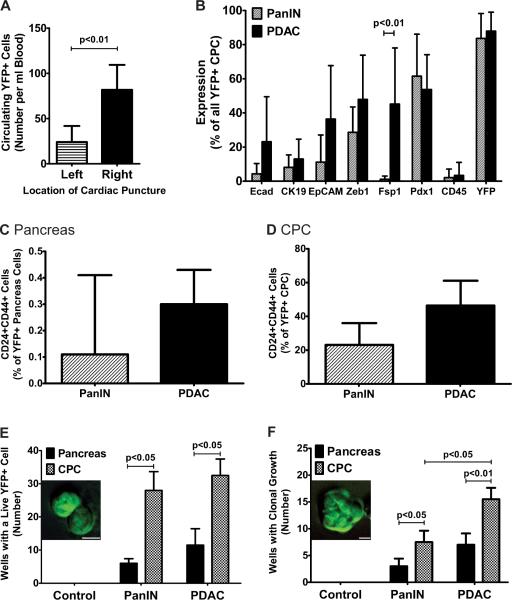
Figure 4. CPC characterization.
(A) Quantification of CPCs after sampling from the left atrium or ventricle (Left) or right atrium or ventricle (Right) of the same animal (n=3). (B) Quantification of FACS staining for epithelial and mesenchymal markers in CPCs obtained from PanIN or PDAC mice (n=6–8 for each data point). (C and D) Quantification of YFP+ cells from the pancreas (C) and circulation (D) in PKCY PanIN and PDAC mice that stained positive for the putative pancreatic cancer stem cell markers CD24 and CD44. (E and F) Quantification of survival (E) or clonal growth (F) of YFP+ cells obtained from lineage-labeled Control (CY), PanIN and PDAC mice in ultra-low attachment wells. Bar graphs show the number of wells (out of 96 wells seeded with a single cell) exhibiting any live YFP+ cells (E, inset) or evidence of clonal growth (F, inset) after 7d. p-values for paired 2-tailed Student's t-tests are shown. Scale bars, 10μm. See also Figure S4.

