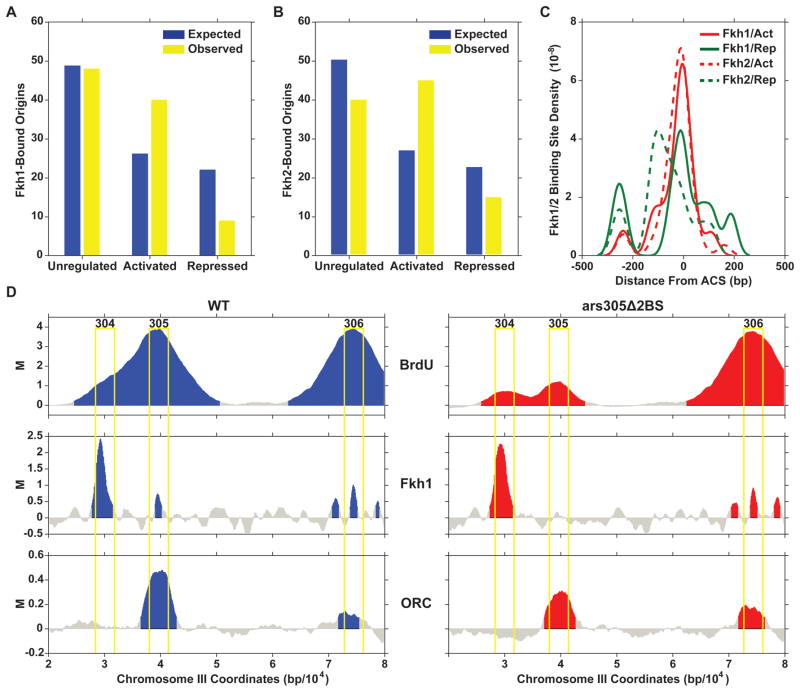
Figure 3.
Analysis of Fkh1 and Fkh2 binding sites near origins. A and B. Frequencies of expected and actual Fkh1 (A) and Fkh2 (B) consensus binding sites near Fkh-activated, Fkh-unregulated, and Fkh-repressed origins are shown. C. Frequency distribution plots of Fkh1 and Fkh2 consensus binding sites relative to ACS position are shown. D. M-values for BrdU-IP-chip and for ChIP-chip of Fkh1 and ORC binding along the ARS305 region in WT cells harboring ARS305 or ars305Δ2BS.

