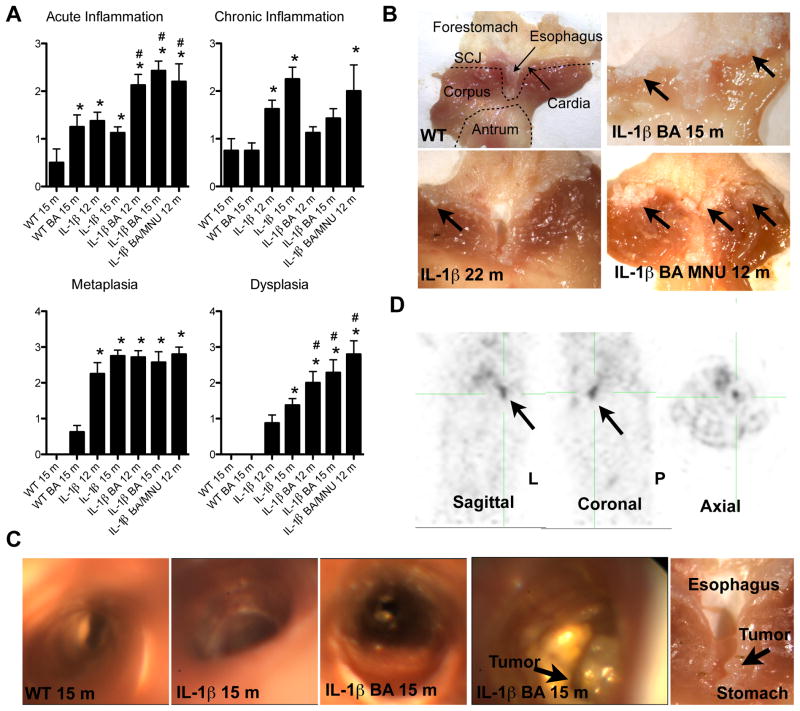
Figure 3. Bile acids and carcinogens accelerate the development of Barrett’s metaplasia and dysplasia.
(A) Histopathological scoring of 6, 9, 12, and 15, months old BA-treated L2-IL-1β mice and combined 12 months old BA and N-Methyl-N-nitrosourea (MNU)-treated L2-IL-1β mice compared to WT (C57/B6) littermates (*p<0.05 compared to WT, #p<0.05 compared to untreated L2-IL-1β mice).
(B) Representative gross pictures of the SCJ in WT, 22 months old L2-IL-1β mice 15 months old BA-treated L2-IL-1β mice and combined BA and MNU-treated 12-month-old L2-IL-1β mice with tumors at the SCJ.
(C) Representative pictures of the esophagus and SCJ during upper endoscopy in intact 15-month-old BA treated or untreated L2-IL-1β mice Ant WT mice and corresponding gross macroscopic evaluation (right).
(D) PET imaging was performed on a rodent microPET scanner to measure glucose uptake in tumors relative to normal tissue. A representative picture of 15-month-old BA treated L2-IL-1β mice is shown in sagittal, coronal and axial position (arrow indicates the tumor, that was macroscopically and histologically confirmed) See also Movie S1-5. (data are represented as mean +/−SEM) See also Figure S3.

