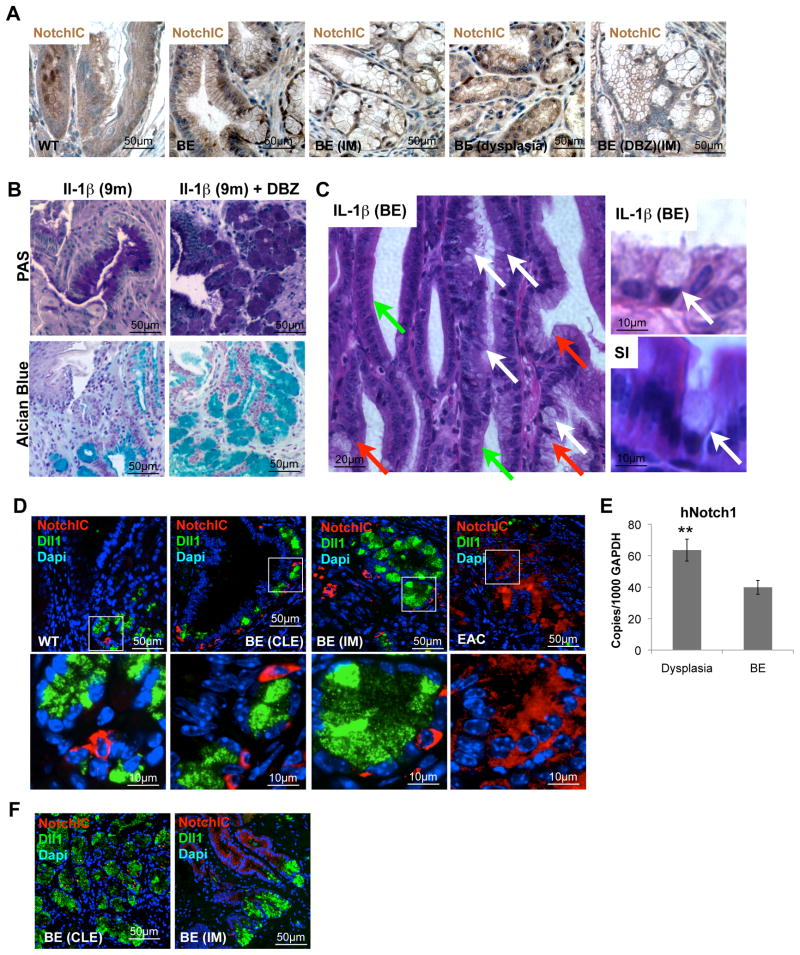
Figure 5. Notch signaling in BE.
(A) Representative pictures of NotchIC IHC in 15 month-old L2-IL-1β BA treated mice and 9 month-old L2-IL-1β mice after γ-secretase inhibitor treatment (DBZ).
(B) Representative pictures of periodic acid-Schiff (PAS) and Alcain-Blue staining at the SCJ of 9 months old L2-IL-1β without and with 10 days γ-secretase inhibitor treatment (right, Notch signaling inhibitor, DBZ).
(C) Representative picture of BE in γ-secretase treated L2-IL-1β mice showing occasional true goblet cells (White arrows), CLE (green arrows) and goblet like cells (red arrows) on the left. On the right goblet cells in BE (top) and small intestine (SI, bottom) are shown to show similarities in intestinal metaplasia.
(D) Representative pictures of NotchIC (red) and Delta-Like1 (DII1) (green) IHC in 9 month old WT, 9 months old L2-IL-1β with BE, and 15 months old BA treated L2-IL-1β with EAC, inserts label magnified area below
(E) mRNA expression (RT-qPCR) of Notch1 in biopsies of esophageal tissue, obtained from 46 patients with BE with and without dysplasia. In each patient, biopsies were taken from Barrett’s mucosa and from dysplastic appearing mucosa
(F) Representative pictures of NotchIC (red) and Delta-Like1 (DII1) (green) IHC in human BE with CLE or IM. See also Figure S4, and Table S2. (data are represented as mean +/−SEM *p<0.05)

