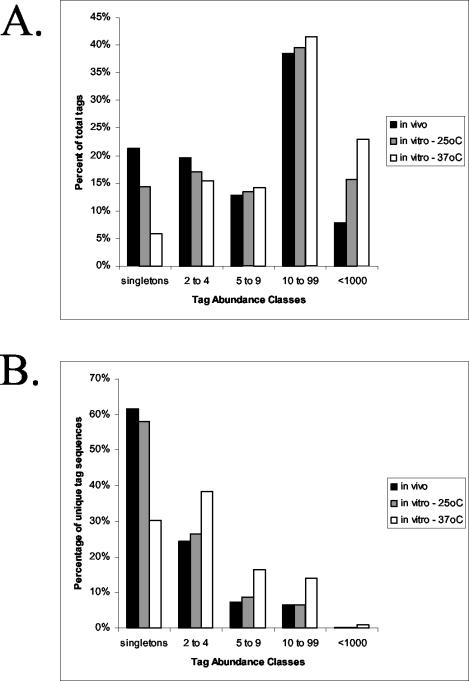
FIG. 1.
Tag distribution in three SAGE libraries. Tags were grouped into categories to illustrate their distribution for the SAGE library constructed from C. neoformans cells grown in the cerebral spinal fluid of rabbits relative to those for the in vitro 25°C and 37°C libraries. The percentage of the total tags that were found in each abundance class is shown (A), and the percentage of unique tag sequences for each abundance class is also presented (B).

