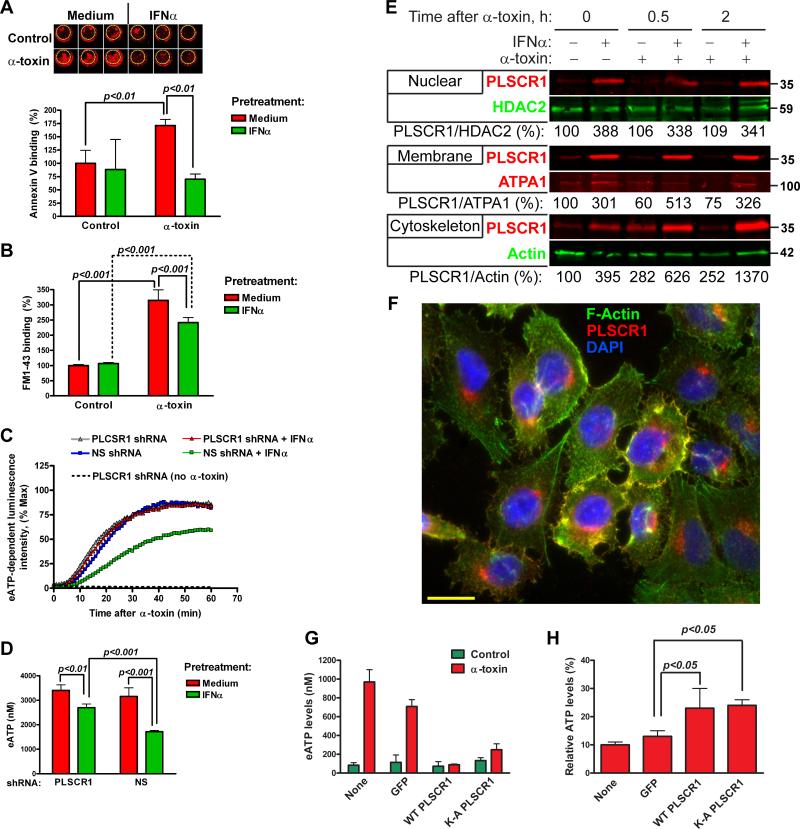
Figure 5.
Effects of IFNα and α-toxin on scrambling of membrane phospholipids, eATP release and PLSCR1 subcellular localization. Translocation of membrane phospholipids was analyzed in A549 cells pretreated with medium or IFNα for 24 h and treated with 2.5 μg/ml α-toxin. (A): Binding of Cy5.5-labeled annexin V to phosphatidylserine on cell surface was measured by LICOR Odyssey imaging system. Representative images and normalized integrated fluorescence intensity at 2 h after α-toxin are shown. The data are mean±SD of triplicate cultures and are representative of three independent experiments. (B): Uptake of lipophilic fluorescent dye FM1-43 at 2 h after α-toxin. Normalized fluorescence intensity is shown. The data are mean±SD of triplicate cultures and are representative of three independent experiments. A549 cells stably expressing PLSCR1-specific or non-silencing (NS) shRNA were pretreated with IFNα and exposed to 2.5 μg/ml α-toxin. (C): Kinetics of eATP release. The curves represent normalized mean luminescence intensity of quadruplicate cultures. (D): Concentration of eATP in the culture medium at 30 min after α-toxin (mean±SD of quadruplicate cultures). The data are representative of three independent experiments. (E): Subcellular protein fractions were obtained from A549 cells pretreated with medium or IFNα and treated with α-toxin for the indicated time points and analyzed for expression of PLSCR1 by immunoblotting. Representative immunoblots and normalized densitometry values from two independent experiments are shown. (F): Immunofluorescence staining for PLSCR1 and phalloidin staining for F-Actin in A549 cells after IFNα pretreatment and α-toxin exposure for 30 min. A representative photomicrograph from two independent experiments is shown; scale bar = 20 μM. A549 cells were transfected with plasmids expressing GFP alone, wild-type PLSCR1 or nuclear localization mutant K-A PLSCR1, sorted for GFP coexpression, replated and treated with α-toxin. (G): Release of eATP was measured at 30 min after α-toxin. (H): Total cellular ATP was measured at 16 h after α-toxin and normalized to total cellular ATP without α-toxin treatment. The data are mean±SD of quadruplicate cultures and are representative of two independent experiments.

