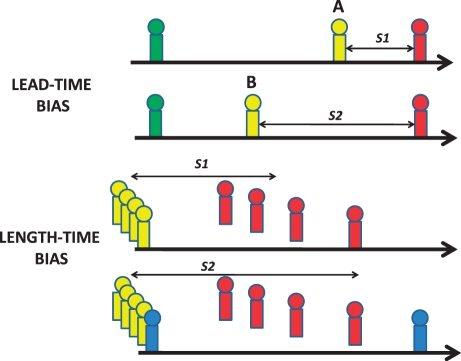
Figure 1.
Representation of health states in lead-time and length-time biases. Green, undetected tumour; yellow, detected tumour; red, dead; blue, incidental non-fatal tumour. Lead-time bias (above) can occur when imaging detects a tumour or recurrence at time B rather than time A but subsequent treatment does not alter the time of death. The apparent survival time is increased from S1 to S2. Length-time bias (below) can occur when an incidental non-fatal tumour is detected by imaging resulting in an apparent increase in survival from S1 to S2.

