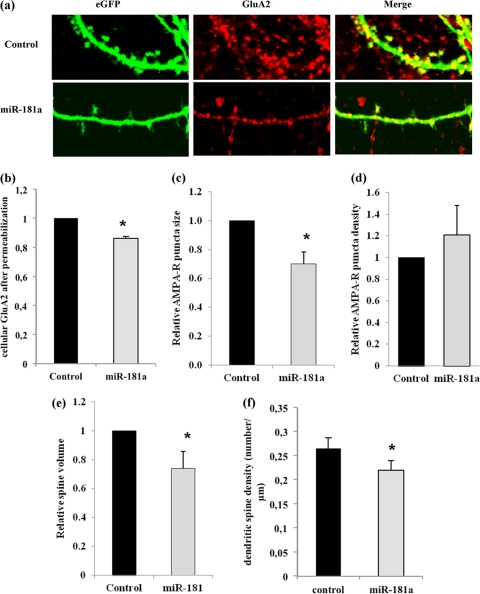
Fig 4.
miR-181a reduces GluA2 surface expression and dendritic spine volume in hippocampal neurons. Primary rat hippocampal neurons were transfected with eGFP plasmid and either miR-181a duplex (25 nM) or scramble pre-miR (control, 25 nM) at 11DIV and processed for immunostaining at 18DIV. (a) Representative images of dendrites from transfected neurons stained with anti-GluA2 under nonpermeablizing conditions. (b) Quantification of anti-GluA2 immunostaining performed under permeabilizing conditions. Data are relative to control transfected cells. Bar graphs represent the mean ± SD (n = 4); *, P < 0.05 (Student's t test). (c) Quantification of anti-GluA2 immunostaining performed under nonpermeabilized conditions. Data are relative to control-transfected cells. Bar graphs represent the mean ± SD (n = 4). *, P < 0.01 (Student's t test). (d) Quantification of the average density (total number/cell area [μm2]) of surface GluA2 clusters. Data are relative to control transfected cells. Bar graphs represent the mean ± SD (n = 4). (e) Quantification of the average spine volume (average mean eGFP intensity of individual spines/total intensity of whole cell) (n = 4; *, P < 0.01). (f) Quantification of the average spine density (total number of spines/dendritic length [μm]). Data are relative to control-transfected cells. Bar graphs represent the mean ± SD (n = 4; *, P < 0.05).

