Fig 1.
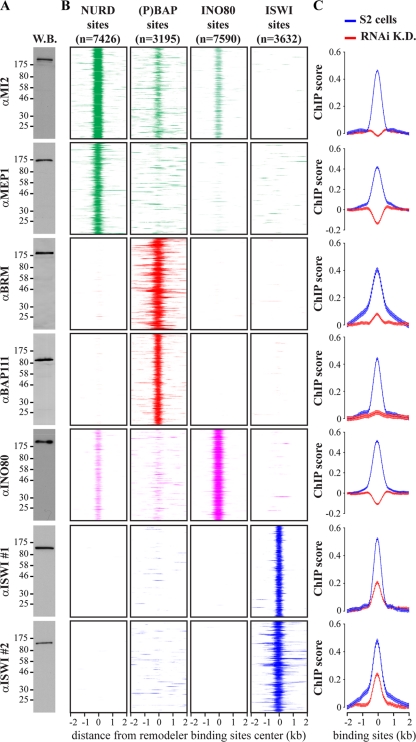
Different remodelers have different genomic distributions. (A) Western blot (W.B.) analysis of embryo nuclear extracts with antibodies raised against indicated remodeler subunits. Positions of molecular weight markers are shown, in kDa. (B) Heatmaps displaying the ChIP chip enrichment on aligned NURD, (P)BAP, INO80, and ISWI loci using the indicated antibodies directed against selective remodeler subunits. Four-kilobase regions were aligned at the center of remodeler binding. The signals for the various remodelers are color coded [green, NURD; red, (P)BAP; magenta, INO80; blue, ISWI], and the numbers of binding sites are shown. (C) Subunits used for the remodelers mapping were depleted by RNAi-mediated knockdown (K.D.). Plots of the averaged ChIP chip enrichment at aligned NURD, (P)BAP, INO80, and ISWI loci are shown before (blue) and after (red) the knockdowns. Distance from the binding site center (±2 kb) is indicated. Whiskers indicate 95% confidence intervals for a mean (CI) calculated with a 50-bp steps from −2 to +2 kb from the center of remodeler loci.

