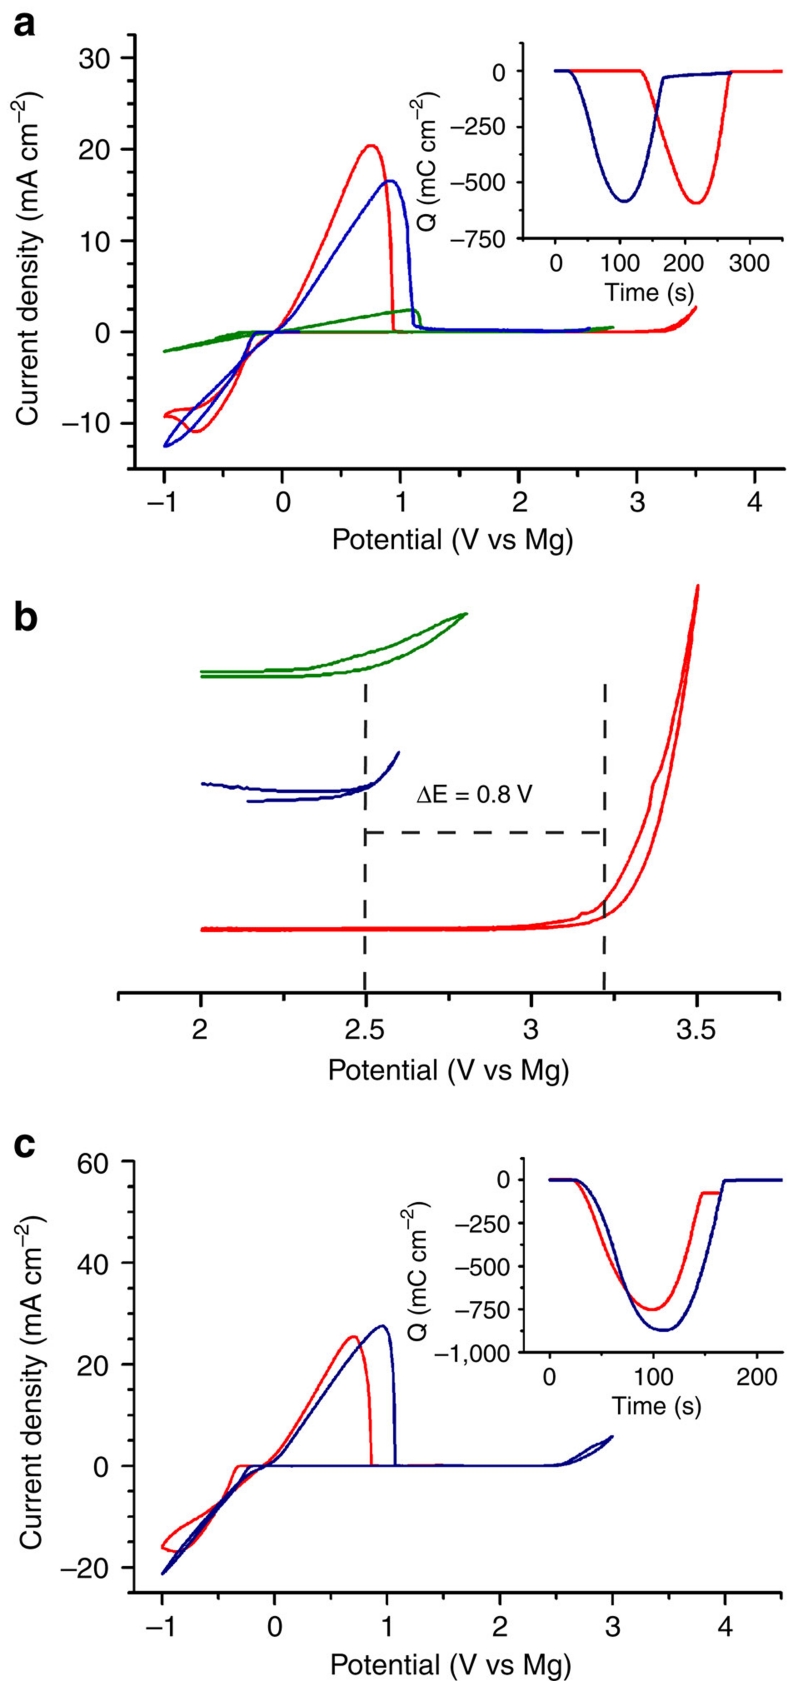
Figure 1. Electrochemical performance of Mg electrolytes.
(a) Cyclic voltammograms of HMDSMgCl (green), the reaction product generated in situ from a 3:1 mixture of HMDSMgCl to AlCl3 (blue), and the crystal obtained from a 3:1 mixture of HMDSMgCl to AlCl3 (red). Inset shows the charge balance during the deposition and the subsequent dissolution of Mg. (b) Enlargement of 2–3.5 V region of (a) highlighting the oxidative stability of the electrolytes. (c) Cyclic voltammograms of 0.4 M THF solution of the reaction product generated in situ from a 2:1 mixture of Bu2Mg to EtAlCl2 (blue), and the crystal obtained from a 2:1 mixture of Bu2Mg to EtAlCl2 (red). Scan rate for all cyclic voltammograms are 0.025 V s−1.

