
Figure 5.
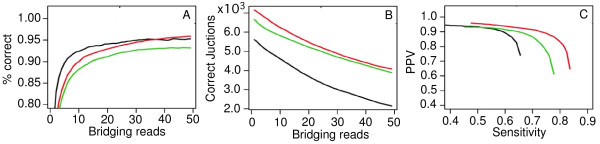
Comparison of RNA-seq reads in matching intron-exon junctions of predicted gene models. (A) Relationship of the numbers of reads bridging an intron and the chance of the intron matching one intron in the predicted gene models. (B) The numbers of introns matching those in the predicted gene models decrease as the numbers of reads bridging an intron increase. (C) Plot of sensitivity against positive predictive value (PPV). Sensitivity is defined as the numbers of matched intron-exon junctions between the predicted gene models and RNA-seq/numbers of intron-exon junctions from predicted gene models, and PPV is the numbers of matched intron-exon junctions between predicted gene models and RNA-seq/total numbers of intron-exon junctions identified from RNA-seq. Red lines, from our strand-specific libraries; green, data from Bartfai et al. [19]; black, data from Otto et al. [17].