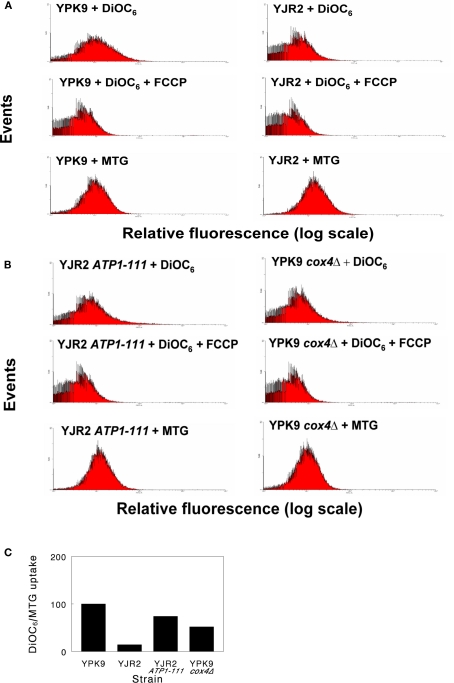
Figure 1.
Typical flow cytometry histograms for estimation of MMP. Cells were grown to mid-log phase and incubated with DiOC6(3) alone, DiOC6(3) + FCCP, or with MTG, as indicated. The geometric mean fluorescence intensities of 30,000 cells (MI) were used to calculate relative MMP. (A) Dye uptake of YPK9 (rho+) cells and YJR2 (rho0) cells. (B) Dye uptake of YJR2 ATP1-111 cells and YPK9 cox4Δ cells. (C) MMP normalized to mitochondrial mass (MTG) for cells in (A,B). Values were determined by subtracting the MI of cells treated with DiOC6(3) + FCCP from cells treated with DiOC6(3) alone and dividing by the intensity of MTG fluorescence.

