
Figure 5.
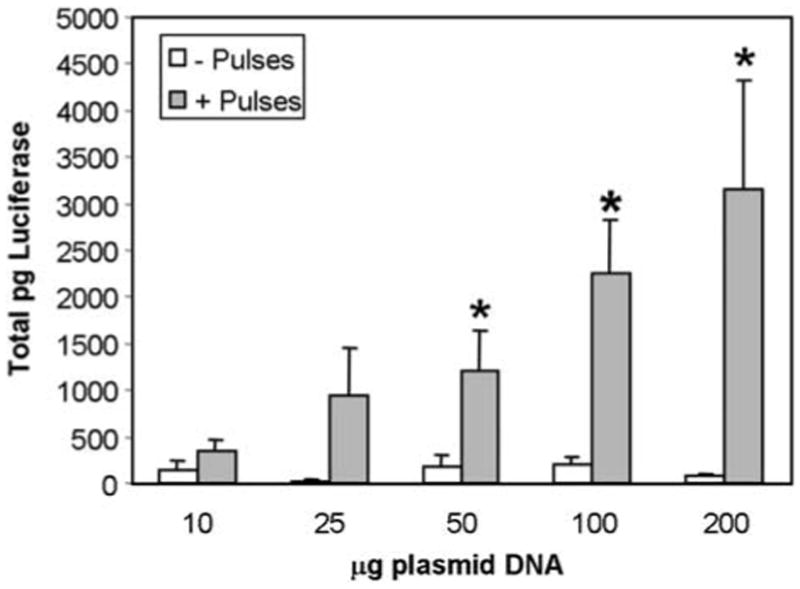
Plasmid dose response. pCMVLuc+ (P) was injected intradermally in 50 μl at increasing concentrations, pulses (E) applied, and luciferase assays performed as described in Figure 2. Data represent mean and standard error of three separate experiments each containing four samples for each time point (total of 12 samples/time point). *P < 0.05