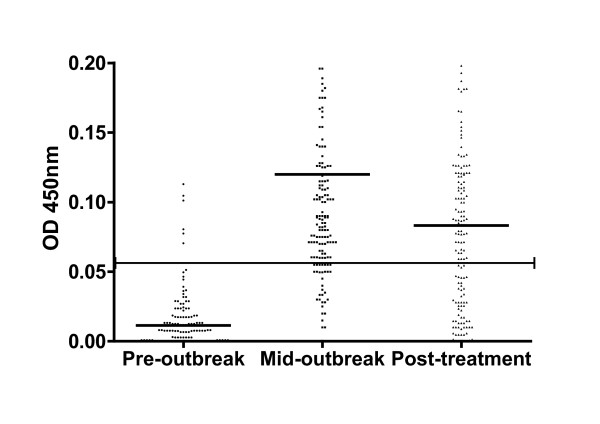
Figure 1.
Scatter plot of individual antibody levels during sheep scab outbreak. Horizontal black line indicates the 0.06 OD450 threshold above which samples were classified as positive for sheep scab. Animals were treated after the mid-outbreak sampling point. Group means indicated by black horizontal lines within individual scatter plots. Thirty seven extreme values (OD 450 values > 0.2) removed from mid-outbreak and post-treatment sample sets to aid with data visualisation, though still contributed to summary statistics.

