
Figure 2.
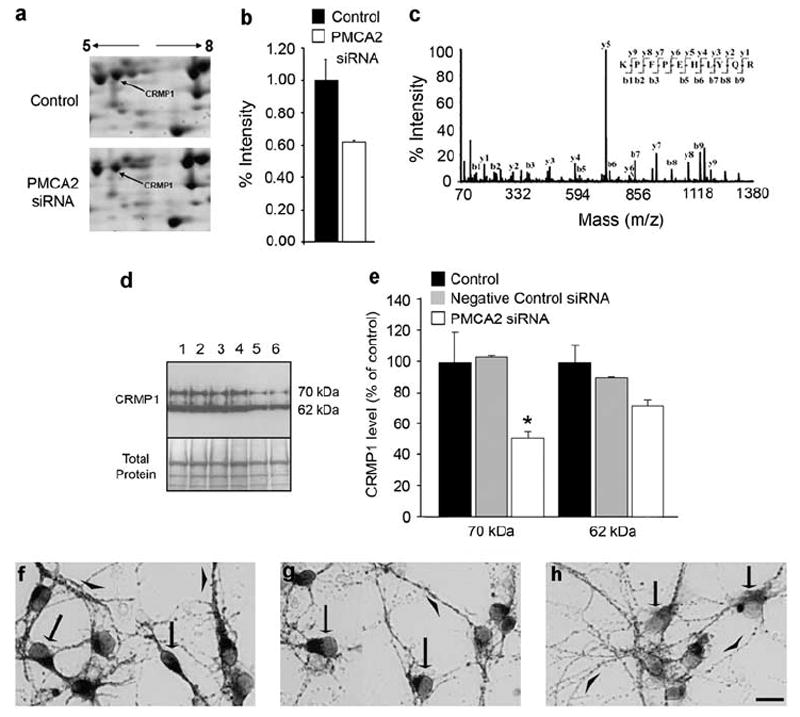
Alterations in CRMP1 levels after silencing of PMCA2 expression. (a) 2DE gel patterns of lysates obtained from the control (top) and PMCA2 siRNA transfected (bottom) SC neuronal cultures. Arrows point at the spot representing CRMP1. (b) Quantification of the signal intensity shows a decrease in the CRMP1 level. (c) A representative tandem mass spectrum of a rat CRMP1 peptide. Peptide sequences of CRMP1 were deduced from the observation of continuous series of either N-terminal (b-series) or C-terminal (y-series) ions. (d) A representative western blot showing CRMP1 levels 24 h after transfection of SC neurons with PMCA2 siRNA. Two bands with molecular weight of ~70 and ~62 kDa were detected. Lanes 1–2: untreated control neurons; 3–4: neurons transfected with scrambled siRNA (negative control siRNA); 5–6: neurons transfected with PMCA2 specific siRNA. (e) The quantitative analysis of the bands at ~70 and ~62 kDa from two independent experiments (n = 6). *P<0.0336, significantly different from control and negative control siRNA by one-way ANOVA, Tukey’s post hoc test. (f) Composite showing CRMP1 positive cells and neurites in control, non-manipulated pure neuronal cultures. (g) Composite showing CRMP1 immunoreactive cells and processes in cultures transfected with scrambled siRNA (negative control) (h) Composite showing decreased CRMP1 staining in cultures transfected with PMCA2 siRNA. Arrows point at examples of labeled cells and arrowheads illustrate the examples of immunoreactive neurites. Bar represents 50 μm