
Figure 5.
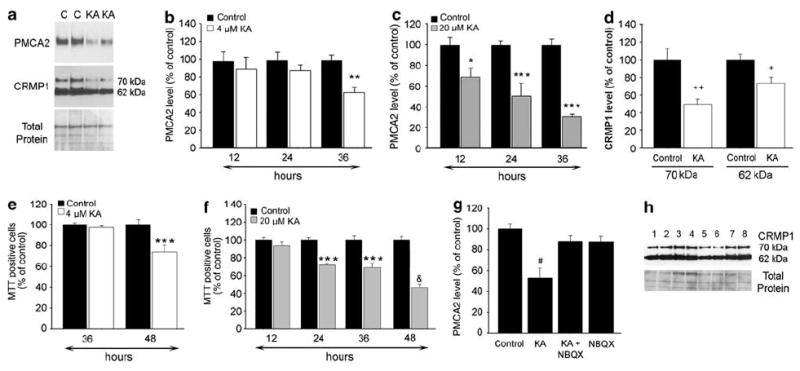
Activation of AMPA/kainate receptors reduces neuronal PMCA2 and CRMP1 levels, in vitro. (a) A representative western blot probed with anti- PMCA2 and anti-CRMP1 antibodies showing a reduction in the levels of both proteins after treatment of neuronal cultures with 4 μM KA or vehicle (Control: C) for 36 h. Lowest panel (total protein) shows the BLOT-FastStain stained membrane, which was used as a control for the experimental variations. (b) PMCA2 levels following the exposure of neurons to 4 μM KA for 12 (n = 8), 24 (n = 11) or 36 (n = 10) hours. (c) PMCA2 levels following exposure of neurons to 20 μM KA for 12 (n = 7), 24 (n = 5) or 36 (n = 5) hours. (d) CRMP1 levels after the treatment of neuronal cultures with 4 μM KA for 36 h. Data from two independent experiments were combined (n = 6). (e) MTT-positive cell number following treatment of neurons with 4 μM KA for 36 or 48 h. (f) MTT-positive cell number following the treatment of neurons with 20 μM KA. Data from two experiments were combined (n = 6–8). (g) PMCA2 levels after co-administration of 10 μM NBQX with 20 μM KA (n = 6). (h) A representative western blot showing CRMP1 levels after co-administration of 10 μM NBQX with 20 μM KA. Lanes 1 and 2: controls; 3 and 4: NBQX; 5 and 6: KA; 7 and 8: KA + NBQX. Values in graph represent mean ± S.E.M. *P<0.05, **P<0.01, ***P<0.001 significantly different from the control and 12 h by two-way ANOVA, Bonferroni posttest; &P<0.001 significantly different from control and all the other groups; +P<0.02, + +P<0.0008 significantly different from control by Student’s t-test; #P<0.0026 significantly different from all the other groups by one-way ANOVA, Tukey’s post hoc test