
FIG. 10.
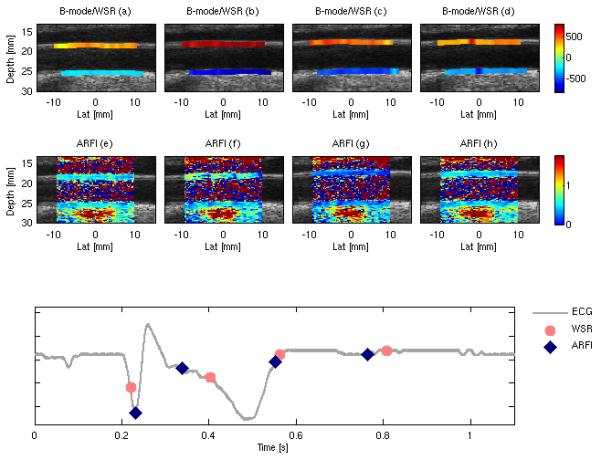
Multi-beat synthesized SAD-Gated depictions of WSR (values shown in s-1) overlaid on the B-mode image (top row) and 2D ARFI displacement (displacements shown in μm) images (middle row) of the common carotid artery for subject N4. The bottom plot shows the timing relationship between the ARFI frames (blue diamonds) and WSR frames (pink circles).