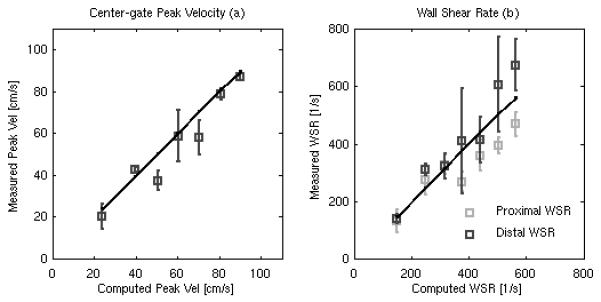
FIG. 4.

Estimated peak velocity (a) and WSR (b) measurements from the steady flow rate rig plotted against the theoretical flow velocities and WSRs calculated from the measured output flow rates. The dark line (a) shows the distal WSR measurement while the gray line (b) shows the proximal WSR measurement. Error bars give the mean and standard deviation across all measurements (n = 105).
