
FIG. 5.
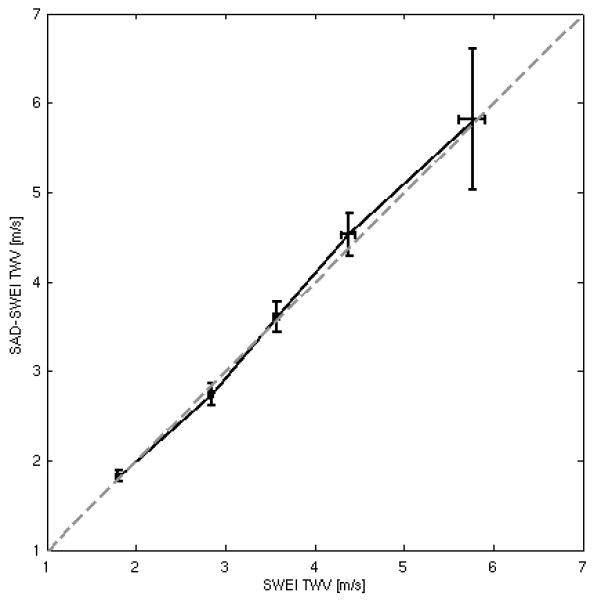
Estimated TWV measurements obtained using the SAD-SWEI sequence plotted against TWV measurements obtained using a conventional SWEI sequence, with the dashed gray line representing equality. Error bars give the mean and standard deviation from fifteen independent spatial locations within each phantom.