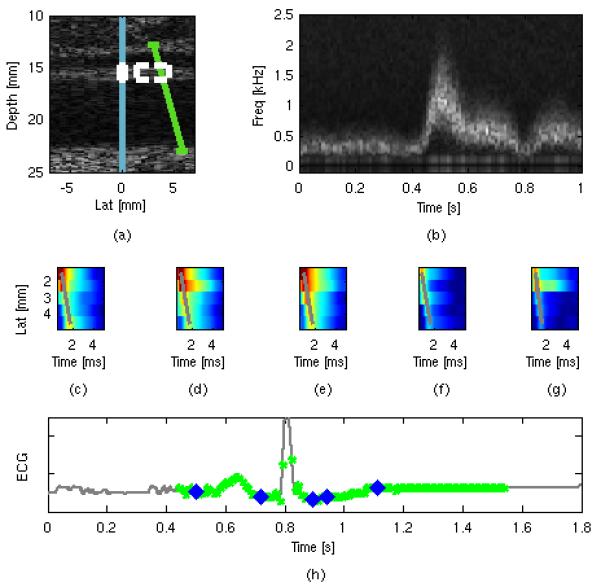
FIG. 6.

Spatial arrangement (a) of the ARFI excitation beam (blue line), on-axis measurement ROI (white box), off-axis TWV measurement ROI (dotted-white box) and spectral velocity ROI (green line) used for in vivo imaging. Sample extracted spectral Doppler frequency (b) plotted as a function of time. Sample raw displacement data used for the TWV estimate (c-g), with the greatest calculated Radon trajectories shown by the grey lines. Timing information (h) shows the temporal registration of the spectral Doppler estimates (green dots) and the ARFI/SWEI frames (blue dots) plotted against the global ECG trace (gray line).
