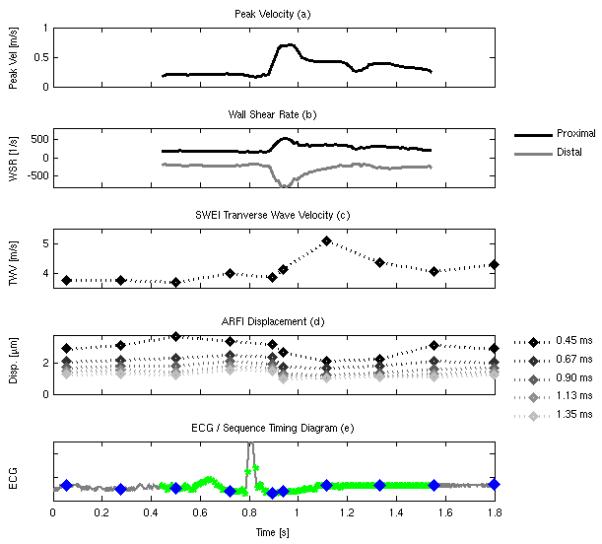
FIG. 7.

Peak flow velocity (a), estimated proximal (black line) and distal (gray line) WSR (b), estimatedTWV (c), on-axis displacement (d), with lighter symbols showing increased elapsed time following excitation (0.45, 0.67, 0.90, 1.13, 1.35 ms), and timing information (e) showing the temporal registration of the spectral Doppler estimates (green dots), the ARFI/SWEI frames (blue dots) plotted against the global ECG trace (gray line).
