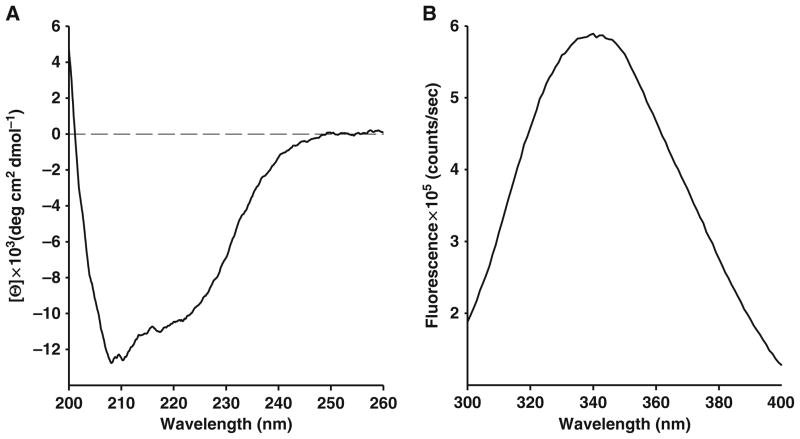
Fig. 24.2.
Characterization of purified human WT-NBD1 (aa 389–673) structure. (a) Measurement of circular dichroism (ellipticity, Θ) of far-UV spectra reveals secondary and tertiary structure of native protein (see Section 3.3). (b) Fluorescence emission scan (300–400 nm), excitation wavelength is 280 nm, peak is at 343 nm (see Section 3.4).

