
Figure 1.
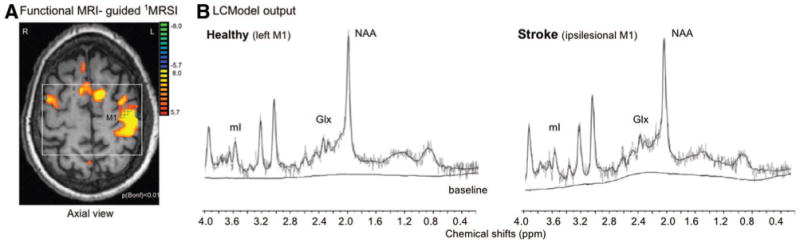
A, 1H-MRS image slab (white box) and spectroscopic voxels (black squares) were positioned according to maximal M1 activation. L indicates left; R, right. B, Left panel, LCModel output from 1 spectroscopic voxel located in left M1 in the healthy control subject (60-year-old man) shown in A. (NAA=14.5 mmol/L, mI=5.2 mmol/L, Glx=14.8 mmol/L). Right, LCModel output from a similar spectroscopic voxel location in the ipsilesional M1 of a stroke survivor (Subject 11, Table 1; 11.5 mmol/L, 7.4 mmol/L, 8.4 mmol/L). ppm indicates parts per million.