
Figure 2.
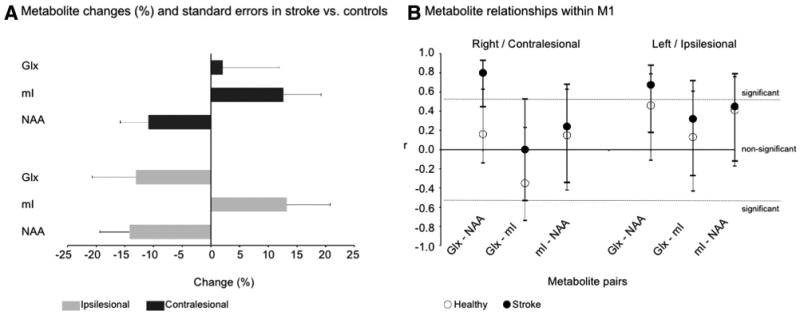
A, Metabolite changes (%) and SE (bootstrapping) in stroke vs controls in ipsilesional (gray bars) and contralesional (black) M1. B, Correlation coefficients (r) and 95% CI between NAA, mI, and Glx within M1 in control subjects (white dots) and patients with stroke (black). Lines indicate the statistically significant r (P<0.05).