
Fig 16.
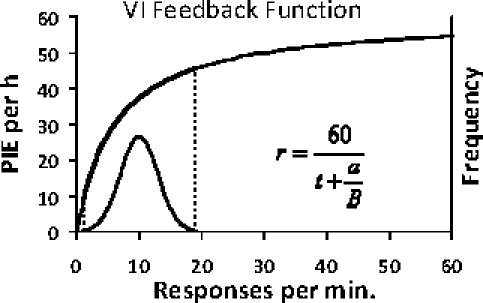
Example of a feedback function for a variable-interval schedule. The upper curve, the feedback function, passes through the origin and approaches an asymptote (60 PIEs per h; a VI 60s). Its equation appears at the lower right. The average interval t equals 1.0. The parameter a equals 6.0. Response rate is expected to vary from time to time, as shown by the distribution below the feedback function (frequency is represented on the right-hand vertical axis).