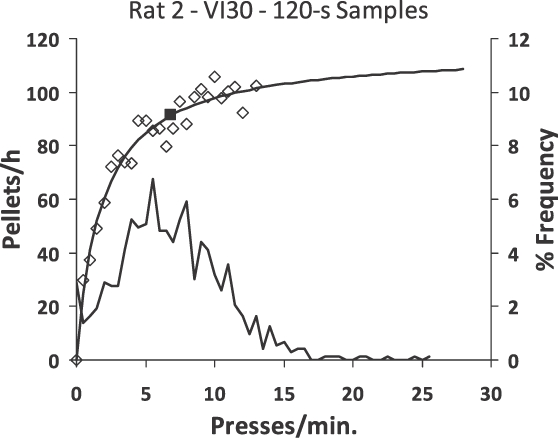
Fig 17.

Example of an empirical feedback function for a variable-interval schedule. Successive 120-s time windows were evaluated for number of lever presses and number of food deliveries. The food rate and press rate were calculated for each number of presses per 120 s. The unfilled diamonds show the food rates. The feedback equation from Figure 15 was fitted to these points (t = 0.52; a = 0.945). The frequency distribution (right-hand vertical axis) below shows the percent frequencies of the various response rates. The filled square shows the average response rate.
