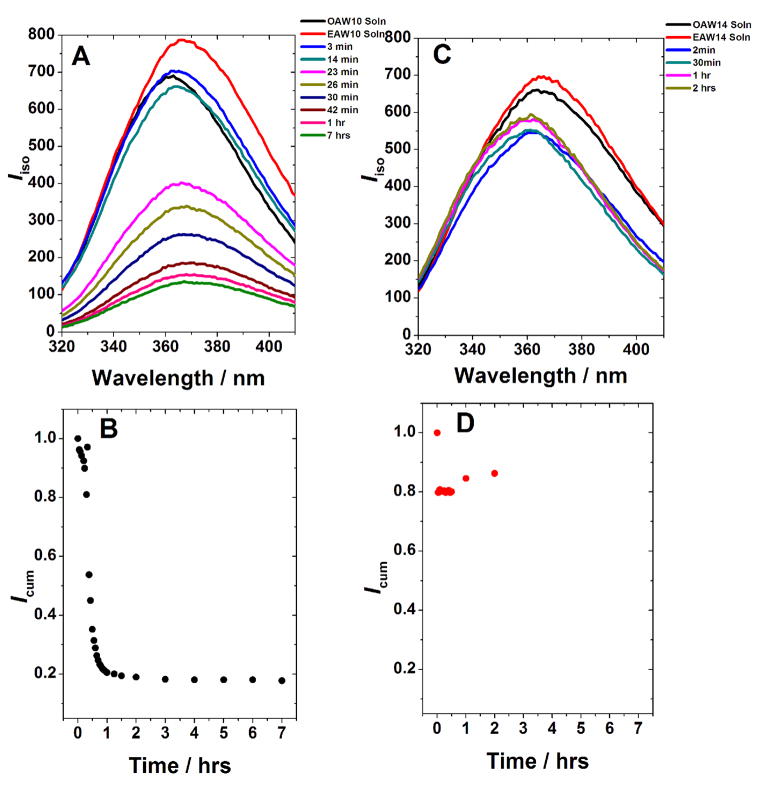
Figure 2.
Tryptophan fluorescence intensity decay during the co-assembling process of the EAW10:OAW10 (A, B) and EAW14:OAW14 pair (C, D) pairs at 25°C. OAW10, EAW10, OAW14 and EAW14 denote individual peptide solutions. (A) and (C) show fluorescence emission spectra at different time points while (B) and (D) plot the normalized cumulative intensity Icum vs. time. In (B) and (D), the data point at time 0 is the average of the two solutions. The EAW6:OAW6 pair did not show any intensity change till 24 h after mixing (ESI, Figure S1).

