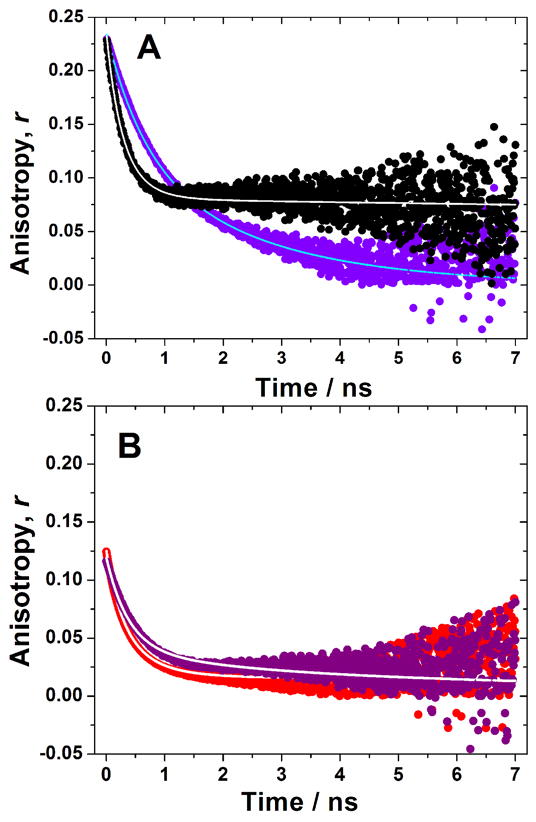
Figure 5.
Time-resolved anisotropy decays in solution and in the gel. (A) Comparison of the EAW10 solution (purple circles) and the EAW10:OAW10 gel (black circles) at 25°C. (B) Comparison of OAW14 solution (purple circles) and the EAW14:OAW14 gel (red circles) at 25°C. Solid lines represent the data fit used to extract the values of rotational correlation time shown in Table 2.

