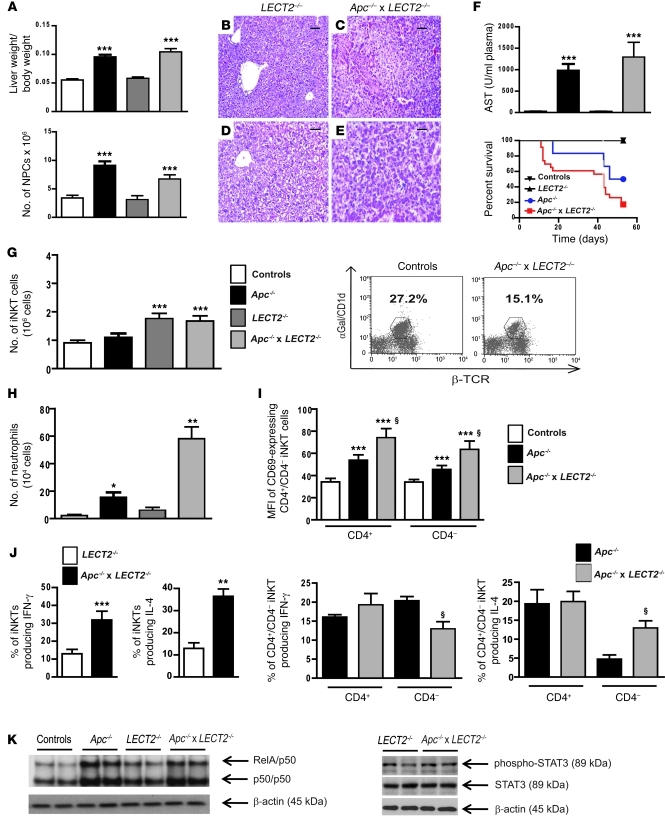
Figure 6. LECT2 has a critical role in shaping the inflammatory environment in β-catenin–activated liver.
(A) The ratio of liver/body weights and the number of NPCs were evaluated in controls, Apc–/–, LECT2–/–, and Apc–/– × LECT2–/– livers 8 days after tamoxifen injection. (B–E) Paraffin-embedded livers sections from the same group of mice were stained with H&E. Scale bars: 100 μm (B and C); 60 μm (D and E). (F) Serum AST levels (upper panel) and Survival curves (lower panel) were assessed in the same conditions. (G) FACS analysis of NPCs using α-GalCer–loaded CD1d tetramers and anti-TCR β chain staining to assess the number (left panel) and proportion (right panel) of iNKT cells in the livers of the same mice groups. (H) FACS analysis of NPCs using anti-Ly6G staining to assess the number of neutrophils. (I) MFI of CD69+ cells in NPCs gated on iNKTs. (J) Intracellular staining for IFN-γ and IL-4 were performed after in vitro stimulation for total (left panel) and CD4+ or CD4– iNKTs (right panel). (K) Nuclear NF-κB activation from LECT2–/– and Apc–/– × LECT2–/– livers was monitored by EMSA. Immunoblotting of phospho-STAT3, STAT3, and β-actin on protein lysates. All data with statistical analysis are representative of 4 experiments with 5 mice/group. *P < 0.05; **P < 0.01; ***P < 0.001 (controls versus Apc–/– or LECT2–/– versus Apc–/–LECT2–/–); §P < 0.03 (Apc–/– versus Apc–/– × LECT2–/–). Error bars represent SD.

