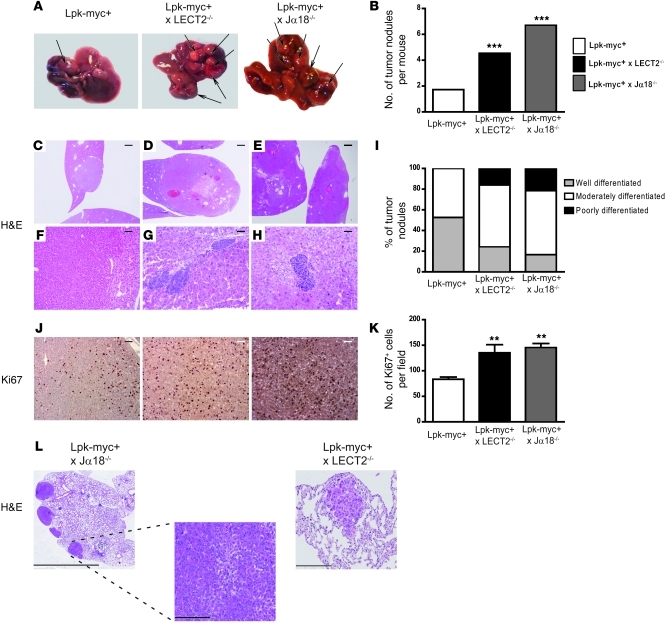
Figure 8. iNKTs and LECT2 are critical cellular and molecular players controlling tumoral progression of β-catenin–dependent liver tumorigenesis.
(A) 12-month-old Lpk-myc+ (n = 12) and Lpk-myc+LECT2–/– (n = 11) or Lpk-myc+Jα18–/– (n = 7) mice were sacrificed, and the number of tumor nodules was evaluated (arrows). (B) The graph represents the mean number of tumors for each group of mice. (C–H) Paraffin-embedded sections obtained from Lpk-myc+, Lpk-myc+LECT2–/–, and Lpk-myc+Jα18–/– livers were stained with H&E, and the grade of differentiation for each tumor nodule was assessed. Scale bars: 1 mm (C–E); 120 μm (F); 60 μm (G and H). (I) The graph shows the mean number of tumors for each group of mice, according to their degree of differentiation. (J) Immunohistochemistry of Ki67 expression was performed on paraffin-embedded sections obtained from Lpk-myc+ and Lpk-myc+LECT2–/– or Lpk-myc+Jα18–/– livers to evaluate the proliferation rate of the tumor nodules. Scale bars: 50 μm. (K) The graph represents the mean number of Ki67+ cells for each group of mice. (L) Paraffin-embedded sections obtained from Lpk-myc+, Lpk-myc+LECT2–/–, and Lpk-myc+Jα18–/– lungs were stained with H&E. Scale bars: 4 mm (left); 200 μm (middle, right).

