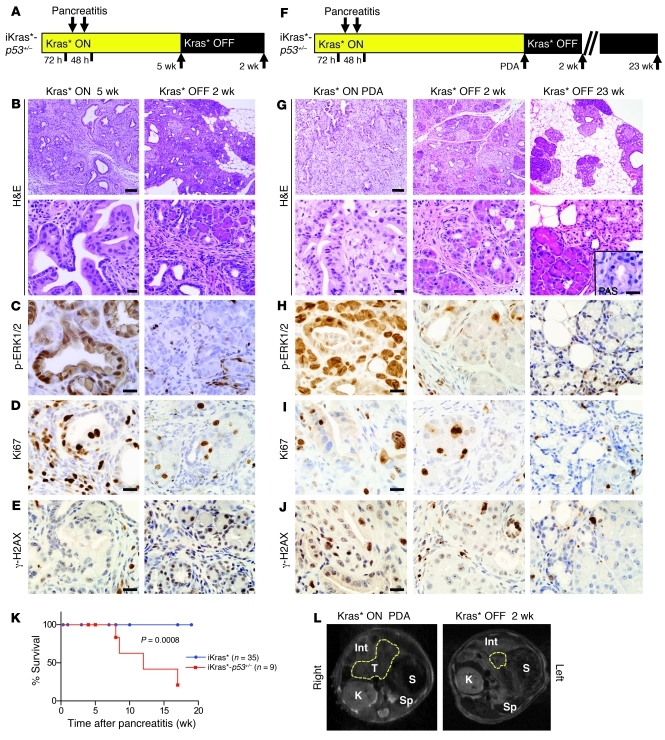
Figure 7. iKras*-p53+/– model and the effect of Kras* inactivation.
Experimental design. Kras* expression was maintained ON for 5 weeks (A) or until the mice developed frank PDA (F) before being turned OFF for 2 weeks or 23 weeks. (B and G) Histology of the pancreata at indicated time points. Scale bar: 100 μm (top row) and 20 μm (bottom row). Inset: PAS staining. Scale bar: 20 μm. (C and H) Phospho-ERK1/2 immunohistochemistry. Scale bar: 20 μm. (D and I) Ki67 immunohistochemistry. Scale bar: 20 μm. (E and J) Analysis of genomic instability in iKras*-p53+/– mice by γ-H2AX immunohistochemistry. Scale bar: 20 μm. (K) Kaplan-Meier survival curve. Log-rank statistical analysis yielded a P value of 0.0008. (L) In vivo imaging of tumor regression in one iKras*-p53+/– animal using MRI. Total animals imaged, n = 4. T, tumor, outlined in yellow; S, stomach; Sp, spleen; K, kidney; Int, intestine.

