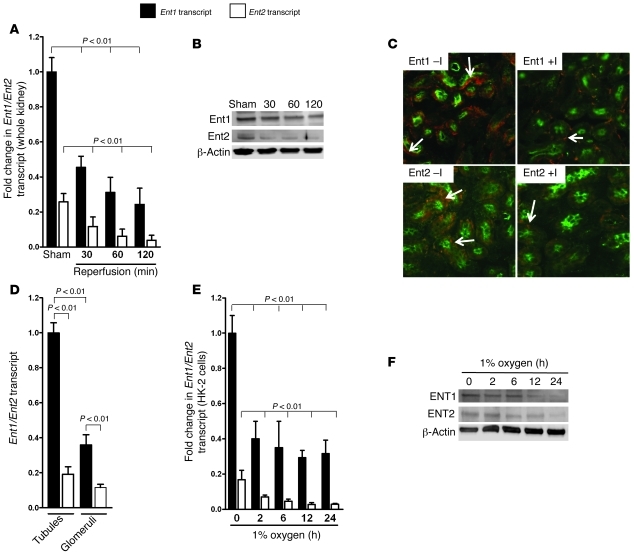
Figure 3. Influence of renal ischemia on ENT expression.
(A) Ent1 and Ent2 transcript levels in kidneys exposed to sham operation (Sham) or 30 minutes of ischemia, followed by reperfusion for the indicated time periods assessed by real-time RT-PCR relative to β-actin (n = 4 independent experiments). (B) Ent1 and Ent2 protein levels assessed by Western blotting (β-actin to control for loading conditions; 1 representative blot of 3 is shown). (C) Comparison of immunoreactivity for Ent1 and Ent2 in kidneys exposed to 30 minutes of renal ischemia and 2 hours of reperfusion or sham-operated controls (original magnification, ×400; fluorescent green: counterstaining for proximal tubules; fluorescent red [arrows]: staining for Ent1 or Ent2; 1 representative image of 3 is displayed). (D) Relative expression levels of Ent1 or Ent2 transcript in isolated tubules or glomeruli, relative to β-actin by real-time RT-PCR (n = 4 independent experiments). (E) ENT1 and ENT2 transcript levels in cultured HK-2 cells exposed for the indicated time periods to ambient hypoxia (1% oxygen) assessed by real-time RT-PCR relative to β-actin (n = 4 independent experiments). (F) ENT1 and ENT2 protein levels from HK-2 cells exposed to indicated time periods to ambient hypoxia (1% oxygen) and assessed by Western blot (β-actin to control for loading conditions; 1 representative blot of 3 is shown).

