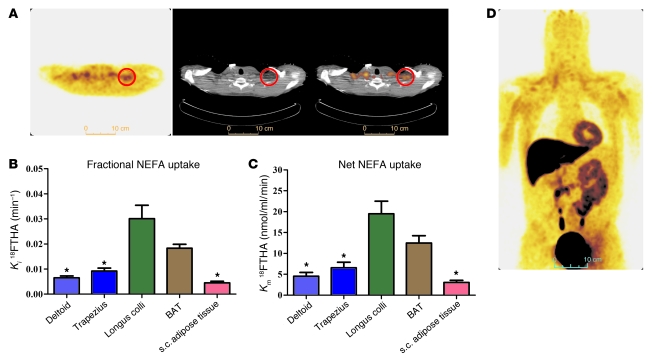
Figure 3. Tissue NEFA uptake.
(A) Transversal PET (left panel), CT (middle panel), and fusion scan (right panel) views of the cervicothoracic junction in one of the participants. Red circles show supraclavicular BAT. (B) Fractional (Ki) and (C) net (Km) NEFA uptake in cervicothoracic tissues. (D) Coronal view (postero-anterior projection) of whole-body 18FTHA uptake during cold exposure. *P < 0.05 versus BAT, ANOVA with Dunnett’s post-hoc test.

