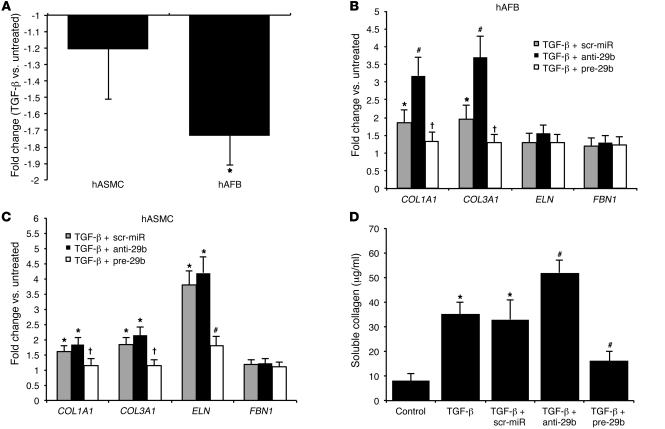
Figure 3. miR-29b in vitro.
(A) miR-29b expression in TGF-β–stimulated hASMCs and hAFBs. (B) Expression levels of miR-29b target genes in Tgf-β–stimulated anti-29b– and pre-29b–transfected hAFBs. (C) Expression levels of miR-29b target genes in Tgf-β–stimulated anti-29b– and pre-29b–transfected hASMCs. (D) Soluble collagen assay to quantify collagen synthesis in Tgf-β–stimulated anti-29b– and pre-29b–transfected hAFBs. Data are mean ± SEM. *P < 0.05 versus untreated. #P < 0.05 versus scr-miR and untreated. †P < 0.05 versus scr-miR and anti-29b.

