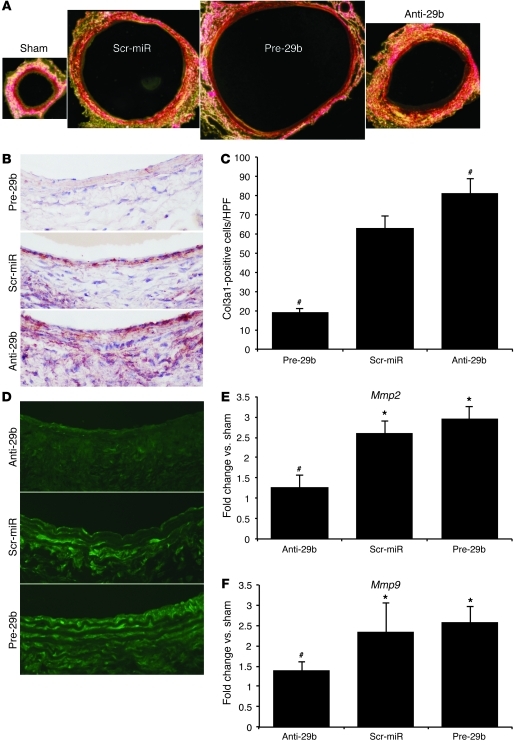
Figure 5. Fibrosis in miR-29b–modulated mice with PPE-induced AAAs.
(A) Representative polarized light microscopy of picrosirius red–stained aortic cross sections (original magnification, ×40), illustrating aneurysm expansion and fibrosis (collagen fibers are bright yellow) in sham, scr-miR, and anti- and pre-29b mice 28 days after AAA induction with PPE. (B) Representative Col3a1 immunohistochemical images, demonstrating effects of pre-29b, scr-miR, and anti-29b 14 days after AAA induction with PPE (original magnification, ×200). (C) Quantification of Col3a1-positive cells in the intima/media region (n = 4 high-power fields of 3 different aortas per group) 14 days after AAA induction with PPE. (D) In situ zymography images to detect MMP activity in scr-miR– and anti- and pre-29b–transduced aortas 14 days after PPE-induced AAA in mice (original magnification, ×200). (E) Mmp2 and (F) Mmp9 expression in miR-29b–modulated mice with PPE-induced AAA (after 14 days). n = 4–8 mice per treatment group. Data are mean ± SEM. *P < 0.05 versus sham. #P < 0.05 versus scr-miR and anti-29b or pre-29b.

