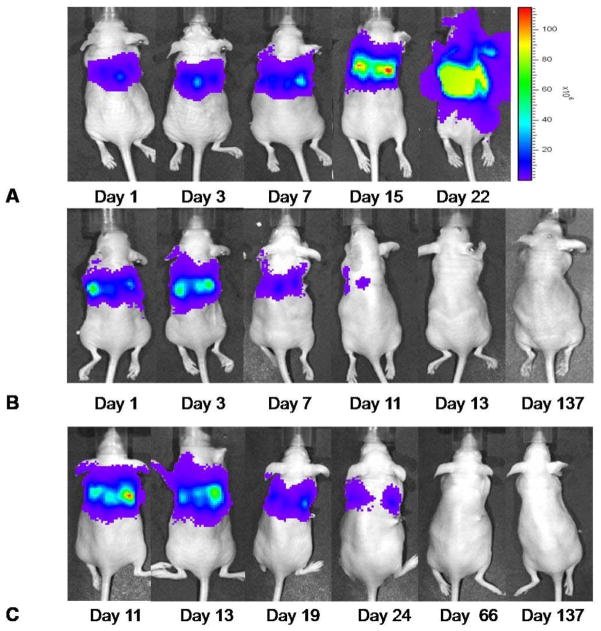
Figure 3. Representative bioluminescence images demonstrate treatment effect of NDV(F3aa)GFP over time.
Images were received 10 min after intraabdominal Luciferin injection with an acquisition time of 1sec. The control animals demonstrate an increasing bioluminescent signal after tumor instillation and had to be sacrificed due to tumor burden at the latest by day 24. Bioluminescent images of a representative animal of the control group are shown in Figure 3A. Animals receiving a single treatment on day 1 showed significant decrease of tumor signal within ten days after treatment. In Figure 3B a representative animal shows complete tumor signal elimination until day 13 after treatment start. Comparable results were investigated in animals receiving multiple treatments starting 10 days after tumor instillation (Figure 3C).

