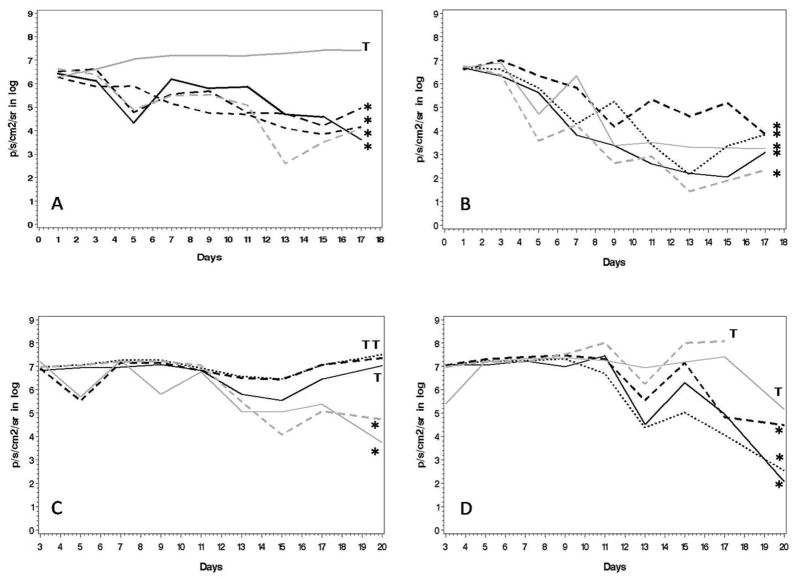
Figure 4. Values of thoracic bioluminescence signal decrease in all treatment groups.
Each graph represents a single animal. Graphs labeled with * represent animals with no bioluminescent sign of tumor 14 days after treatment initiation. Graphs labeled with T represent animals with persistent tumor burden 14 days after treatment start. Bioluminescent values (p/s/cm2/sr) were calculated as following: (prone + spine value)/2. In the upper row animals are shown who received treatment starting one day after tumor injection. In the lower row animals are presented with treatment start on day 10 after tumor injection. A and C show animals who received single treatment, B and D represent animals with multiple treatments. The mean bioluminescent signal values decreased significantly more in animals receiving multiple treatments (day 1: p <0.01; day 10: p <0.01).

