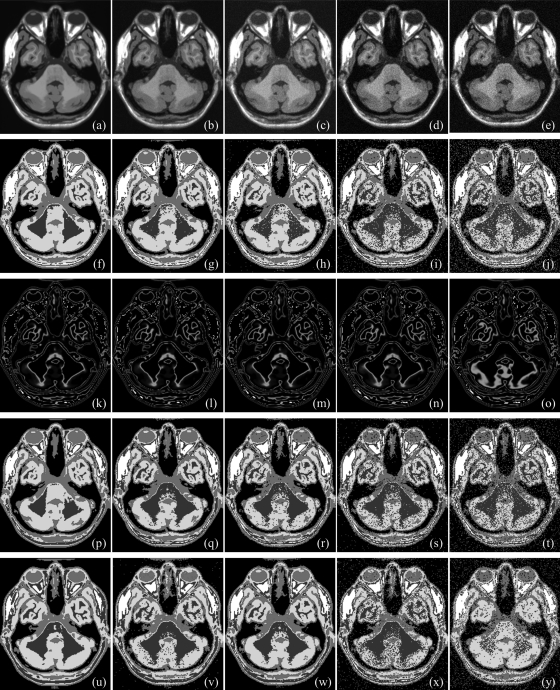
Figure 10.
Results of thresholding on MR brain phantom images at different noise levels: 0% (a), 3% (b), 5% (c), 7% (d), and 9% (e). (f–j) Results of thresholding by the new method for (a–e), respectively, at different noise levels. (k–o) Class uncertainty images at optimum thresholds of (f–j), respectively. (p–y) Same as (f–j) but for Otsu’s (p–t) and the MHUE (u–y) methods, respectively.

