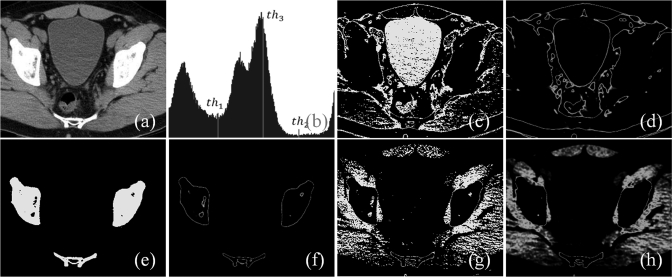
Figure 2.
An illustration of the relationship between class uncertainty and tissue interfaces under different conditions of thresholding. (a) An image slice from a CT data of a patient’s lower abdomen. (b) Image intensity histogram for (a) with three thresholds marked as , , and . The first two thresholds are manually selected to segment proper tissue regions while the third one is intentionally picked as a bad threshold. (c,d) Thresholded tissue regions and class uncertainty image for the threshold . (e,f), (g,h) Same as (c,d) but for thresholds and , respectively. Note that class uncertainty images in (d) and (f) depict respective tissue boundaries while the same in (h) fails to indicate any tissue interface and spills out into the entire soft tissue region.

