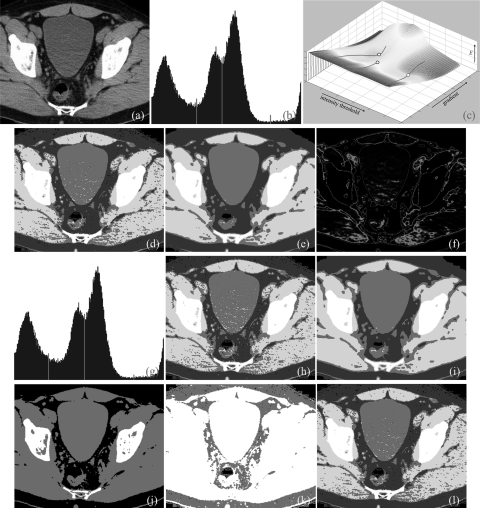
Figure 6.
Results of application of different thresholding methods on a CT image slice of lower abdomen. (a) Original CT image slice. (b) Optimum thresholds (red lines) derived by the new method. (c) The energy surface with valley lines and optimum threshold and gradient parameters (hollow circles). (d) Thresholded regions in different colors as applied to the original image. (e) Same as (d) but applied to a smoothed image. (f) Object class uncertainty maps at different optimum thresholds. Note that the class uncertainty image highlights different tissue interface at different optimum thresholds. (g,h,i) Same as (b,d,e), respectively, but for Otsu’s method. (j,k,l) Results of thresholding as obtained by the MSII, ME, MHUE algorithms, respectively. One of the merits of the proposed method is that by incorporating spatial information, the new method succeeds in dealing with all three examples of Figs. 678; however, Otsu’s method succeeds in Fig. 6 but clearly fails in Fig. 8.

