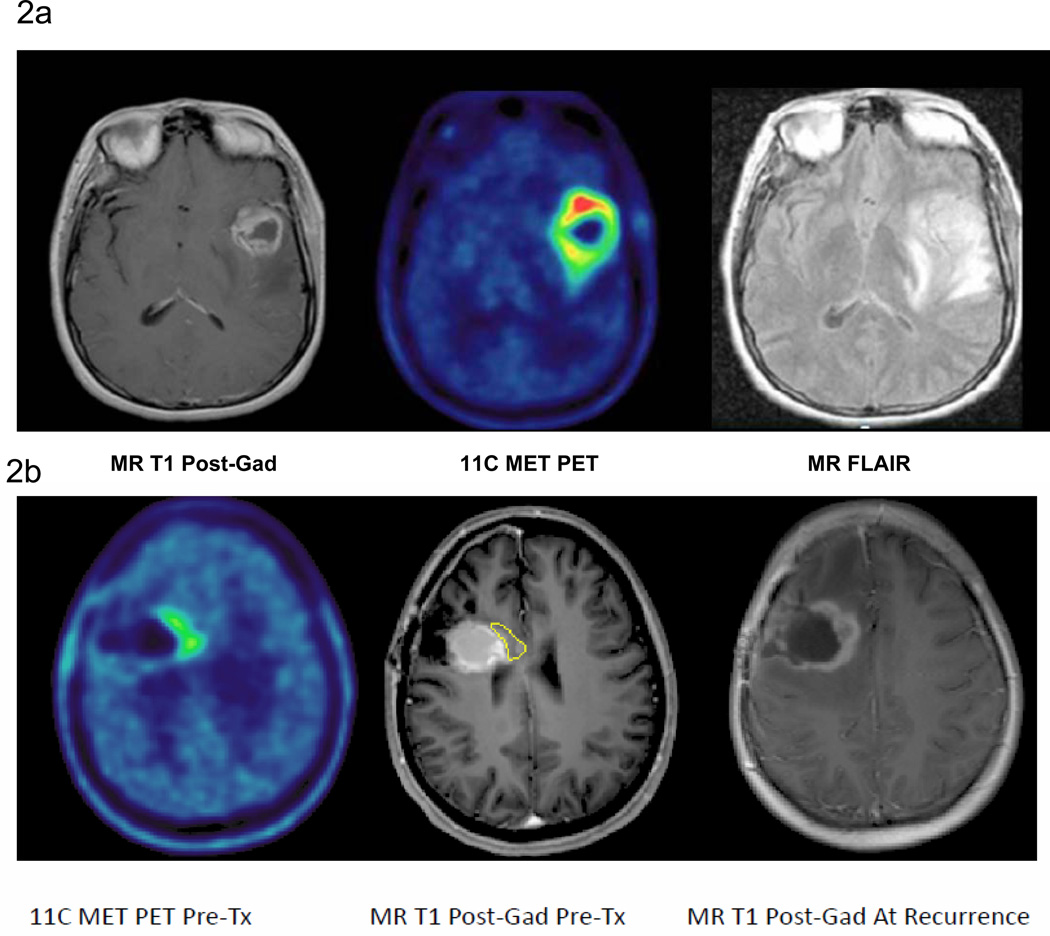
Figure 2.
a 11C MET PET (middle panel) clearly demonstrates areas of increased metabolic uptake extending beyond the contrast-enhancing lesion on MRI (left panel) but not beyond MR FLAIR.(right panel) MR FLAIR volume also includes surrounding peritumoral edema.
b Pre-treatment post gadolinium T1-weighted MRI (middle panel) has been co-registered to the pre-treatment 11CMET-PET scan (left panel) as well as the post gadolinium T1-weighted MRI at recurrence (right panel). This example shows the overlap between the area of initial increased PET uptake (yellow) and eventual area of recurrence.

