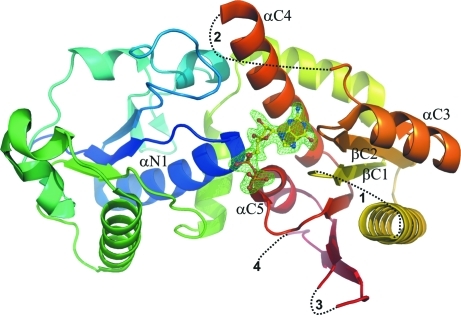
Figure 3.
The structure of the NodZ–GDP complex, with the GDP molecule shown in stick representation. The protein chain is shown in cartoon rainbow-coloured representation from blue (N-terminus) to red (C-terminus). The difference F o − F c OMIT map for the GDP molecule is contoured at 2.5σ. Dashed lines and the numbers 1–4 correspond to gaps in the model. The β-strands and α-helices involved in ligand binding are labelled.

