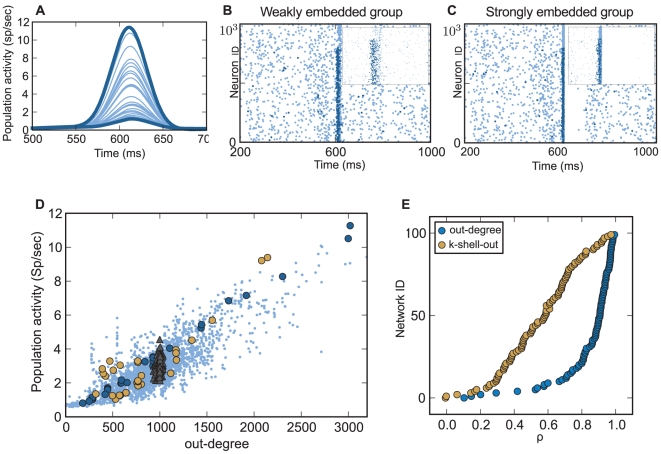
Figure 2. Structural embeddedness and population response.
(A) Network response (PSTH) for identical stimulation of 30 different subpopulations of 250 neurons each (thin blue lines) in one example network. Observe that peak, onset, and rise times of responses of each subpopulation differ greatly. The thick blue lines depict the smallest and the biggest response, respectively. (B) Rasterplot of the network when the subpopulation of neurons with the lowest degree of embeddedness was stimulated. Light blue dots denote spikes from all neurons, dark blue dots those from stimulated ones. Inset: Magnified cut-out around 600 ms for neurons 4000–6000. Activation of weakly embedded neurons does not spread much in the network. (C) As in (B), but now the subpopulation with the highest average degree of embeddedness was stimulated, leading to a much bigger impact on the network activity. Activation of these strongly embedded neurons lead to a spreading of activity throughout the network. Moreover, feedforward inhibition suppressed the network activity entirely. (D) Response of all stimulated subpopulations (250 neurons each) and all networks pooled together (pale blue dots). On average, there was a positive correlation between out-degree and total network activity ( = 0.84). Two networks with small-world properties are highlighted (dark blue, light amber dots). The five random networks (filled gray triangles) did not exhibit high out-degree variance, and therefore the variance of their population response was small compared to that of the small-world networks. (E) Average correlation coefficient (sorted) between population response and degree of embeddedness as measured by out-degree and k-shell-out index. Both metrics had a high predictive power, with out-degree maintaining high prediction rates for most of the graphs. However, the predictive power of topology measures depended also on additional criteria (cf. main text and Figure 3).

